🌐 Global Economy Briefing — 2026-04-22
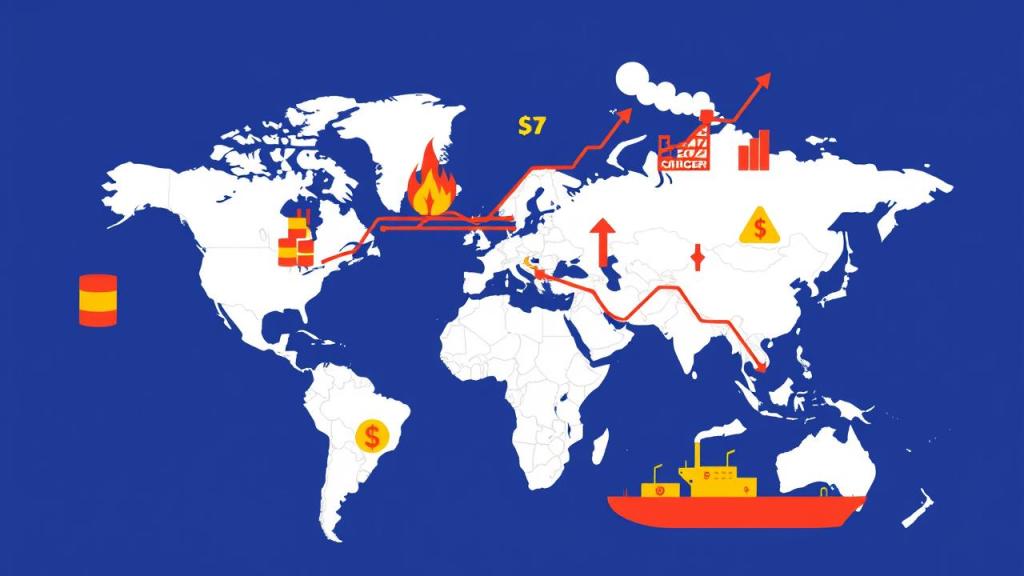
The global economy is navigating its most severe energy shock in modern history, as the US-Israel war against Iran chokes off Strait of Hormuz shipping and sends oil prices toward $115 per barrel. The IMF, meeting for its April Spring Sessions, has cut its 2026 global growth forecast to just 3.1% — well below pre-pandemic norms — warning that risks are “decisively on the downside.” From frozen Fed rate cuts in Washington to surging inflation across Asian import-dependent economies, today’s briefing maps the fault lines of a world economy under sustained geopolitical fire.
🛢️ Hormuz Choke Point Shuts Down: World Oil Supply Hits Historic Low
🔥 Worst Oil Supply Disruption in History — 9.1 Million Barrels a Day Gone
Global oil supply collapsed by 10.1 million barrels per day in March as attacks on Middle East energy infrastructure and Strait of Hormuz shipping restrictions created the largest supply disruption ever recorded, sending Brent crude on a trajectory toward $115/bbl by Q2 2026.
📰 A War That Began in February Is Now Felt at Every Gas Station on Earth
The US-Israel military operation against Iran, launched on February 28, rapidly escalated into a sustained assault on Iranian energy infrastructure and tanker routes. Attacks on Hormuz-bound shipping have made insurers unwilling to underwrite passage, effectively shutting down one-fifth of global seaborne oil transit. The monthly average for production shut-ins peaked at 7.5 mb/d in March and is expected to climb to 9.1 mb/d in April as the conflict shows no sign of de-escalation.
📊 KEY DATA
▸ Global oil supply: plunged to 97 mb/d in March (down 10.1 mb/d) ▸ Production shut-ins: 7.5 mb/d (March), forecast 9.1 mb/d (April) ▸ Brent crude: $103/bbl March avg → $115/bbl Q2 forecast peak ▸ WTI: $91.27/bbl as of April 20 ▸ US retail gasoline: forecast peak $4.30/gal in April ▸ US diesel: forecast peak $5.80+/gal in April
🌍 From Tokyo to Frankfurt, Every Energy Import Bill Is Exploding
Energy-importing nations across Asia and Europe are absorbing the sharpest price shocks. Japan and South Korea — which source the majority of their crude from the Persian Gulf — face rising trade deficits and weakening currencies. European manufacturers already squeezed by Chinese competition now face a second front of higher energy costs threatening industrial output through summer 2026.
👁 WHAT TO WATCH
Strait of Hormuz ceasefire or rerouting negotiations; IEA strategic petroleum reserve release coordination; OPEC+ emergency meeting signals; May WTI and Brent futures pricing; tanker insurance market developments.
🎙 EXPERT TAKE
The IEA’s April 2026 Oil Market Report described the March supply collapse as “the largest disruption in history,” adding that continued attacks on energy infrastructure make any near-term stabilization scenario contingent entirely on diplomatic progress (IEA, April 2026).
💡 The Strait of Hormuz Is Now the World’s Most Expensive Economic Chokepoint
Until shipping resumes through the Strait of Hormuz, every other economic policy tool — rate cuts, stimulus, trade deals — is working against a rising energy headwind that no central bank can directly control.
📉 IMF Cuts Global Growth to 3.1% — Slowest Since the Pandemic
🔥 “Global Economy in the Shadow of War” — IMF’s Darkest Outlook in Years
The IMF’s April 2026 World Economic Outlook, published during the Spring Meetings in Washington, slashed the global growth forecast to 3.1% for 2026 — well below the pre-pandemic average of around 3.8% — and warned that a prolonged Middle East conflict, deepening geopolitical fragmentation, and renewed trade tensions could push outcomes even lower.
📰 War, Trade Tensions, and AI Uncertainty: Three Storms Converging at Once
The IMF identified a convergence of risks rarely seen simultaneously: active military conflict disrupting energy and shipping; a structural shift toward geopolitical fragmentation of trade and investment; and the possibility that AI-driven productivity gains may arrive more slowly than markets expect. Global trade growth is also projected to slow later in 2026, weighed down by persistent trade tensions and rising logistics costs from Hormuz disruptions. Inflation, which had been on a downward trajectory, is now expected to tick back up through 2026 before resuming its decline in 2027.
📊 KEY DATA
▸ Global GDP growth: 3.1% (2026 forecast), 3.2% (2027) ▸ Pre-pandemic avg growth: ~3.8% ▸ Global inflation: ticking up through 2026 ▸ Emerging market inflation: concentrated pressure from energy costs ▸ UNCTAD: trade growth slowing in H2 2026
🌍 Commodity-Importing Developing Nations Bear the Sharpest Pain
The IMF singled out commodity-importing emerging market and developing economies — particularly those with pre-existing fiscal vulnerabilities — as the most exposed. Countries in Sub-Saharan Africa, South and Southeast Asia that depend on imported oil and food face simultaneous current account deterioration, currency pressure, and reduced fiscal space to respond.
👁 WHAT TO WATCH
IMF-World Bank Spring Meetings follow-up policy commitments (April 24–26); G7 foreign ministers’ statement on Middle East; next WEO update timeline; whether the IMF activates emergency lending facilities for vulnerable members.
🎙 EXPERT TAKE
IMF Chief Economist Pierre-Olivier Gourinchas, at the April 14 Spring Meetings press briefing, stated: “Risks are decisively on the downside” and characterized the current era as one of “more frequent and violent shocks” reshaping the global policy landscape (IMF, April 2026).
💡 The War Premium Is Now Embedded in Every Economic Forecast Through 2027
The IMF’s downgrade means the world is already pricing in a prolonged conflict — and any escalation from here carries outsized downside risk for growth and financial stability globally.
🇺🇸 Fed Freezes Rate Cuts as Inflation Bounces Back in the US
🔥 Two Years of Rate Cuts Halted — Fed Won’t Move Again Until December
After cutting rates by a cumulative 1.75 percentage points since August 2024, the Federal Reserve is now on hold through the end of 2026, as rising energy prices reignite inflation pressures and cloud the economic outlook just as US growth is visibly slowing.
📰 The Easing Cycle That Ran Out of Road — Geopolitics Trumps the Fed’s Playbook
The Fed’s patient pivot toward normalization has been overtaken by events: US regular gas prices jumped from $2.98 to $3.45 per gallon in a single week following the Hormuz disruptions, with diesel costs approaching historic highs. Payroll growth slowed further in March as firms reported greater reluctance to hire amid heightened uncertainty, while GDP growth is slowing to 1.7% on a Q4-to-Q4 basis in 2026. The Fed’s dual mandate — maximum employment and price stability — is now pulling in opposite directions.
📊 KEY DATA
▸ Fed funds rate: 3.50–3.75% (on hold through December 2026) ▸ US GDP growth: 2.2% full-year 2026, 1.7% Q4/Q4 basis ▸ Unemployment: 4.4% (expected to drift to 4.2% by Dec 2026) ▸ US gas prices: $2.98 → $3.45/gal in one week; forecast peak $4.30/gal ▸ S&P 500 earnings growth: ~16% projected (large caps lagging)
🌍 Dollar Strength and Rate Pause Squeeze Emerging Market Borrowers
A Fed on hold for the remainder of 2026 keeps the dollar relatively strong, raising debt-servicing costs for emerging markets with dollar-denominated liabilities. Countries in Latin America and Southeast Asia that had expected rate-cut relief from the US are now facing a tighter financial environment at precisely the moment their own inflation is rising on oil costs.
👁 WHAT TO WATCH
May CPI data release (key signal for Fed trajectory); Q1 2026 GDP advance estimate; June FOMC meeting statement; April payrolls report; consumer confidence surveys through May.
🎙 EXPERT TAKE
J.P. Morgan Asset Management notes that equity market performance has been “uneven in 2026, with large caps lagging meaningfully,” and that despite projected 16% S&P 500 earnings growth, geopolitical uncertainty is creating a significant risk premium across asset classes (J.P. Morgan Asset Management, April 2026).
💡 America’s Rate-Cut Cycle Is on Ice — and Inflation Is Back in the Driver’s Seat
Until energy prices stabilize, the Fed has no runway to resume cutting — leaving American consumers and businesses to absorb both slowing growth and rising costs simultaneously.
🌏 Asia’s Energy Import Dependency Turns Into a Liability
🔥 Asia Inflation Set to More Than Double in 2026 as Oil Shock Lands
The IMF projects emerging Asia’s inflation rate will surge from just 1.1% in 2025 to 2.6% in 2026 — a more than doubling driven almost entirely by the energy shock — as the region’s deep structural reliance on Middle East oil imports is suddenly exposed as a critical vulnerability.
📰 Decades of Gulf Oil Dependency Come Due as the Hormuz Tap Runs Dry
Asia-Pacific nations collectively import more than two-thirds of their oil needs, much of it transiting the Strait of Hormuz. South Asia — including India, Pakistan, Bangladesh, and Sri Lanka — is expected to see GDP growth slow to 6.3% in 2026, down from 7% in 2025, as energy subsidy costs rise and export competitiveness weakens. The IMF’s Regional Economic Outlook for Asia-Pacific, published April 16, concluded that the energy shock is simultaneously “raising inflation, weakening external balances, and narrowing policy options” across the region.
📊 KEY DATA
▸ Emerging Asia inflation: 1.1% (2025) → 2.6% (2026) ▸ Asia-Pacific growth (IMF): 4.4% (2026), 4.2% (2027) ▸ South Asia growth: 7% (2025) → 6.3% (2026) ▸ ADB regional growth projection: 5.1% (2026) ▸ China growth: 4.4% (World Bank, 2026)
🌍 Tech Exporters Cling to AI Tailwinds While Energy Importers Struggle
The energy shock is deepening a divide within Asia itself. Taiwan and South Korea — whose exports are dominated by semiconductors and AI-related technology with strong global demand — are better insulated than oil-dependent manufacturing nations like Thailand, Vietnam, and Bangladesh. The divergence risks fracturing the region’s coordinated growth narrative and could prompt currency intervention from central banks trying to arrest inflation-driven depreciation.
👁 WHAT TO WATCH
Asian central bank emergency rate decisions (India’s RBI, Bank of Thailand, Bank Indonesia); China’s strategic oil reserve drawdown announcements; India’s April inflation print; ADB April 2026 Asian Development Outlook full release.
🎙 EXPERT TAKE
The IMF’s Regional Economic Outlook for Asia and Pacific (April 16, 2026) stated plainly that the energy shock is “underscoring the region’s dependence on imported oil and gas” and that policymakers face a narrowing set of tools to respond without triggering either currency crises or deflationary policy tightening (IMF, April 2026).
💡 Asia’s Growth Story Now Has a Single Variable: How Long the War Lasts
With inflation and current account pressures building across the region, Asia’s economies are now hostage to a geopolitical timeline they cannot control — making diplomatic resolution of the Middle East conflict the single most important economic variable for the region’s 4.4 billion people.
🇨🇳🇪🇺 China Floods New Markets as Europe Fights a Two-Front Battle
🔥 Chinese Export Machine Pivots to Africa and ASEAN as the US Door Closes
With direct exports to the United States declining sharply, China is rapidly diversifying its export base toward Africa, the European Union, and ASEAN — flooding these markets with competitively-priced goods at a scale that is visibly squeezing the profit margins of local and European manufacturers.
📰 Overcapacity Meets Decoupling: Beijing Rewrites the Global Trade Map
China’s structural overcapacity in sectors ranging from electric vehicles and solar panels to steel and chemicals is depressing production prices domestically and undermining the competitiveness of European and emerging market manufacturers. Analysts at Deutsche Bank and Coface warn this is “not a temporary phenomenon” but a durable structural shift that will pressure European industrial margins for years. Meanwhile, China’s economy is growing at a revised 4.4% in 2026 (World Bank), supported by policy stimulus despite continued weakness in domestic consumer demand.
📊 KEY DATA
▸ China 2026 GDP growth: 4.4% (World Bank) ▸ Eurozone growth: ~1% (2026) ▸ China exports to US: sharply declining ▸ China exports to Africa, EU, ASEAN: rising ▸ European manufacturing margins: under sustained downward pressure ▸ Official China growth target: 5%
🌍 European Manufacturers Caught Between Cheap Imports and Surging Energy Bills
The European industrial sector is being hit from both sides simultaneously: Chinese overcapacity is compressing revenues, while the Middle East energy shock is inflating input costs. This double squeeze is particularly acute for Germany’s automotive and chemical sectors, which are simultaneously competing against Chinese EV exports, paying higher energy prices, and navigating slower domestic and export demand.
👁 WHAT TO WATCH
EU anti-dumping investigation outcomes on Chinese EVs and steel; China-EU trade summit scheduled for Q3 2026; China April export data release; Eurozone April PMI flash estimate; European Commission industrial policy response package.
🎙 EXPERT TAKE
Coface and Deutsche Bank analysts jointly warn that Chinese overcapacity represents “a significant and likely lasting trend” that is “squeezing the turnover and margins of European manufacturers” — and that European businesses must fundamentally redefine their competitive strategies rather than wait for the pressure to subside (Deutsche Bank / Coface, March–April 2026).
💡 China Is Rewriting the Global Trade Map — and Europe Is Absorbing the Collateral Damage
As Beijing redirects its export machine toward new markets, European policymakers face an urgent choice: accelerate industrial policy and trade defenses, or risk a structural hollowing-out of their manufacturing base.
※ This content is automatically generated from public news sources. For reference only — not investment advice.
