🌐 Global Economy Briefing — 2026-04-18
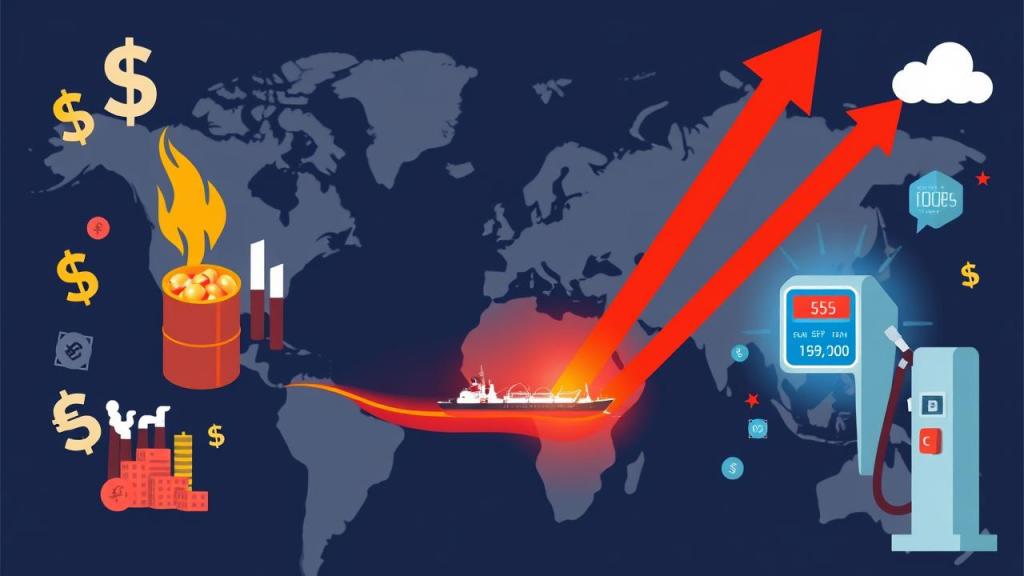
The global economy is navigating its most serious energy shock since the 1970s, as the US-Israel military campaign against Iran has effectively paralyzed the Strait of Hormuz — the artery through which roughly 20% of the world’s oil and liquefied natural gas flows. Brent crude rocketed to nearly $128 per barrel in early April before settling around $97, and the IMF has slashed its 2026 global growth forecast to 3.1% while pushing inflation projections to 4.4%. From American gas stations to European factories and Asian supply chains, the economic aftershocks are reshaping priorities everywhere.
🌊 Strait of Hormuz Blockade Triggers Largest Oil Shock in History
🔥 Brent Crude Hits $128 as Hormuz Chokes Global Supply
Global oil supply plummeted by 10.1 million barrels per day in March — the largest single-month disruption in recorded history — after sustained attacks on energy infrastructure and tanker restrictions choked traffic through the Strait of Hormuz. Brent crude prices peaked at nearly $128 per barrel on April 2, before easing to around $97 by mid-April.
📰 A War That Rewrote the Energy Map Overnight
The US-Israel military campaign against Iran, launched on February 28, has evolved into an extended conflict with no clear resolution timeline. Tehran’s capacity to threaten or disrupt Hormuz shipping — through which roughly 20% of global LNG and oil transits — has turned a regional war into a worldwide energy crisis. Iran’s own GDP is now projected to contract by 6.1% in 2026, a downward revision of 7.2 percentage points from January forecasts.
📊 KEY DATA
▸ Global oil supply drop: −10.1 mb/d (March 2026) ▸ Brent peak: ~$128/b (April 2, 2026) ▸ Brent as of April 16: $97.06/b ▸ Iran GDP revision: −7.2 pts → −6.1% ▸ Saudi Arabia growth cut: 4.5% → 3.1% ▸ Global oil demand now projected to contract by 80 kb/d in 2026
🌍 Commodity Exporters Gain, Energy Importers Bleed
While oil-exporting nations outside the conflict zone stand to benefit from elevated prices, the majority of the global economy — particularly energy-importing emerging markets — faces a severe terms-of-trade deterioration. Fertilizer and gas prices have also spiked, raising food production costs. The IEA warns that if Hormuz restrictions persist through summer, the secondary inflation wave could be significantly worse than March’s initial shock.
👁 WHAT TO WATCH
Monitor ceasefire negotiations between the US, Israel, and Iran (no date set); IEA’s May Oil Market Report (due mid-May); and weekly US EIA inventory data for signs of strategic reserve drawdowns. Any resumption of Hormuz tanker traffic would be the most significant downward catalyst for oil prices.
🎙 EXPERT TAKE
“This is not a price spike — it is a structural supply disruption that markets have never had to price before,” warned the IEA in its April 2026 Oil Market Report. J.P. Morgan Global Research notes that sustained Brent above $100 for a full quarter would tip several emerging market economies into balance-of-payments crises. (IEA / J.P. Morgan, April 2026)
💡 The Strait of Hormuz Has Become the World’s Most Dangerous Economic Bottleneck
Until the conflict stabilizes, the Strait of Hormuz will function as a tax on the entire global economy — one that falls hardest on the countries least able to absorb it.
🇺🇸 US Economy Absorbs the Shock — But Cracks Are Showing
🔥 Gas Prices Jump 16% in One Week as Consumers Feel the Burn
American consumers are experiencing the conflict’s impact at the pump: regular gasoline prices surged to $3.45 per gallon in mid-April, up sharply from $2.98 just one week earlier — a 16% jump in seven days. Meanwhile, the S&P 500 is holding at 7,041 but the high-growth “Magnificent Seven” tech stocks have shed approximately 12% year-to-date.
📰 A Resilient Economy Running Into a Geopolitical Wall
The US economy entered 2026 with considerable momentum — the Fed had cut rates by 1.75 percentage points from the 2024 peak, bringing the fed funds rate to 3.50%–3.75%, and real GDP was on track for 2.2% growth. But the Middle East war has introduced an external shock that monetary policy cannot directly offset, and policymakers face a classic stagflationary dilemma: inflation driven by supply disruption, not demand excess.
📊 KEY DATA
▸ S&P 500: 7,041 (mid-April) ▸ “Magnificent Seven” YTD: −12% ▸ Gas price: $3.45/gal (up from $2.98, one week prior) ▸ Fed funds rate: 3.50%–3.75% ▸ US GDP growth forecast 2026: 2.2% ▸ WTI futures (April): $91.27/b
🌍 Dollar Strength Exports Pain to Emerging Markets
Risk-off flows into the US dollar during the conflict have strengthened the greenback, compounding debt-service burdens for emerging market economies with dollar-denominated liabilities. Countries in Latin America and Sub-Saharan Africa with high import bills and limited currency reserves are particularly vulnerable to this secondary transmission channel.
👁 WHAT TO WATCH
US CPI for March (due week of April 20) will be the key data point to gauge how quickly energy prices are feeding into core inflation. The Fed’s May FOMC meeting will signal whether policymakers lean toward holding rates to fight renewed inflation or cutting to support growth.
🎙 EXPERT TAKE
“The Fed is in a very uncomfortable position — they’ve cut rates to support the economy, but now they’re staring at an exogenous inflation shock they can’t control,” noted Deloitte’s US Economics team in their April 2026 outlook. Bank of America’s private banking unit flagged national debt sustainability and tariff uncertainty as the two biggest longer-term risks to the US outlook. (Deloitte / Bank of America, April 2026)
💡 The Fed’s Rate-Cut Cushion May Not Be Enough for a Supply-Side Shock
The US economy has buffers, but the collision of energy-driven inflation and slowing growth is testing the limits of monetary policy as a stabilizing tool.
🌏 Emerging Asia’s Growth Engine Sputters Under Energy Pressure
🔥 Emerging Asia Growth Slips to 5% as Energy Costs Surge
The IMF has revised Emerging Asia’s 2026 GDP growth down to 5.0% from 5.6% in 2025, as higher energy prices drive up production costs and consumer inflation. South Asia is seeing an even sharper deceleration — from 7% growth in 2025 to a projected 6.3% in 2026 — with India’s trajectory closely watched by global investors.
📰 Export Front-Loading Fades, Energy Bills Arrive
Much of Asia’s resilience in 2025 was built on export front-loading ahead of US tariff increases and a semiconductor boom driven by AI demand. That tailwind is now normalizing, just as the Hormuz crisis delivers a second hit through rising energy import bills. Nations with limited fiscal space — particularly smaller ASEAN economies — face difficult tradeoffs between supporting growth and keeping inflation in check.
📊 KEY DATA
▸ Emerging Asia GDP growth 2026: 5.0% (down from 5.6% in 2025) ▸ South Asia GDP growth 2026: 6.3% (down from 7% in 2025) ▸ Regional inflation: rising to 3.6% in 2026 ▸ Taiwan & South Korea: still supported by AI semiconductor demand ▸ IMF policy recommendation: “narrowly targeted” fiscal measures (April 16, 2026)
🌍 AI Tailwinds Keep Tech Exporters Afloat
Not all of Asia is suffering equally. Taiwan and South Korea, as global hubs for advanced semiconductor manufacturing, continue to benefit from surging global AI infrastructure demand — providing a partial offset to the energy price drag. However, the divergence between tech-enabled export economies and energy-import-dependent developing nations is widening, creating a two-speed Asia story.
👁 WHAT TO WATCH
The Asian Development Bank’s full April 2026 Outlook will provide country-level projections. Key data to track: India’s April inflation print, China’s Q1 GDP, and ASEAN central bank policy decisions over the coming weeks as they balance growth support against inflation risks.
🎙 EXPERT TAKE
“Emerging Asia needs narrowly targeted policies to shield the most vulnerable from energy shocks while avoiding broad stimulus that could entrench inflation,” the IMF said in an April 16 statement. S&P Global Ratings flagged that geopolitical strife is “stalling the momentum” built through 2024–2025, with supply chain diversification efforts now complicated by energy cost uncertainty. (IMF / S&P Global Ratings, April 2026)
💡 Asia’s Growth Story Is Splitting Along an Energy Fault Line
The region’s AI-powered tech exporters are holding up, but energy-dependent developing economies face a genuine growth threat that targeted policy alone may struggle to fully contain.
🇪🇺 Europe Caught Between War and Chinese Competition
🔥 European Gas Prices Double as Hormuz Disrupts LNG Supply
European natural gas prices have surged 98% since the outbreak of the Middle East conflict, as approximately 20% of global LNG supplies that transit through the Strait of Hormuz are now disrupted or rerouted. The price shock is compounding the squeeze on European manufacturers already battling Chinese competition in global markets.
📰 Fighting on Two Fronts: War Inflation and the China Export Flood
Europe was already under structural pressure before the Middle East conflict escalated. Chinese manufacturers, facing weak domestic demand at home, have been aggressively expanding export volumes — depressing prices for European goods in third markets and squeezing industrial margins. Goldman Sachs estimates that intensifying Chinese export competition will reduce euro area GDP by approximately 0.5% by end-2029, even before factoring in energy cost headwinds.
📊 KEY DATA
▸ European gas prices: +98% since conflict outbreak ▸ Euro area GDP growth 2026: ~1.3% ▸ China competition drag on euro area GDP: −0.5% by end-2029 (Goldman Sachs) ▸ Germany: fiscal stimulus providing partial offset ▸ Spain: outperforming regional peers ▸ ~20% of global LNG transits Hormuz
🌍 Germany’s Stimulus Cushions the Blow, But Unevenly
Germany’s fiscal expansion is providing some counterweight to the energy shock, helping underpin the euro area’s 1.3% growth projection. However, the benefits are unevenly distributed — industrial-heavy economies like Germany and Italy bear disproportionate energy costs, while service-oriented Spain continues to outperform. Eastern European economies with higher energy intensity face even sharper impacts.
👁 WHAT TO WATCH
The ECB’s April/May policy meeting will be critical — markets are watching whether the bank holds rates amid renewed inflation or pivots to support growth. Euro area flash PMI data for April (due April 23) will give an early read on industrial stress. EU tariff response to Chinese industrial overcapacity is also a key policy development to monitor.
🎙 EXPERT TAKE
“Europe is being squeezed from both sides — a geopolitical energy shock and a competitive industrial shock arriving simultaneously,” wrote Coface economists in their April 2026 European business risk assessment. Goldman Sachs estimates the combined impact of Chinese export pressure and energy costs could shave nearly 1 full percentage point off euro area activity over the medium term. (Coface / Goldman Sachs, April 2026)
💡 Europe’s Industrial Model Faces Its Sharpest Test in a Generation
With energy prices spiking and Chinese competition intensifying simultaneously, European policymakers must choose between protecting competitiveness and controlling inflation — and neither option is comfortable.
※ This content is automatically generated from public news sources. For reference only — not investment advice.
